A friend of mine was exposed to Covid-19 at work a few weeks ago. Everyone was wearing masks, everyone was vaccinated but it was still scary. He was instructed to isolate and contact his doctor for advice. So that’s what he did.
Friend: “Should I get at home test?”
Doctor: “Sure, but those have a high false negative rate, so I wouldn’t trust it.”
And I thought, wait? There are people thinking they’re in the clear, but in reality, they’re walking around with covid? That doesn’t sound right! A medical test is a classifier: a prediction system that outputs the labels “Sick” or “Healthy” and any classifier has misclassification error. A test trying to identify a disease (especially a comunicable one!) is going to have asymmetrical misclassification cost. Put in plain language: it’s better to think you have Covid-19 when you don’t than it is to think you don’t have Covid-19 when you do1. An at home test like that would be a disaster for public health. You want the first easy test to be a screener, something that divides the world into “you’re probably okay” and “you may not be okay, let’s follow up.”
So we looked up the sensitivity and specificity of the brand of Covid-19 antigen test that he bought. Sure enough, the sensitivity was 74% and the specificity was 99%.
Sensitivity is the ability of a test to identify all the sick people in a given population – it’s calculated as the proportion of positive tests of sick individuals to the population of all sick individuals. Specificity is the ability of a test to identify all the healthy people in a population – it’s calculated as the proportion of negative tests of healthy individuals to all healthy individuals. And do I have to look up which is which every time I try to use one term or the other? You bet I do. So I made a cheatsheet reminder. You can find that in my resources. False Negative Rate, which is the metric cited by the doctor is 1-sensitivity, and False Positive rate is 1- specificity.
But wait! Are sensitivity/false positive rate and specificity/false negative rate even the right metrics for this situation? What we really wanted was the positive predictive value and the negative predictive value. Sensitivity and specificity are population measures, but my friend was one person with a negative test. What he wanted to know is given that his test came up negative, what were the chances he had Covid?
Because we don’t have the sick to healthy ratio for the test, we can’t actually determine the PPV and NPV from the sensitivity/specificity studies and I couldn’t find the counts of each group in the study. But if we make an assumption about the ratio, we can guess. I’m assuming 8% disease rate for the population in question - this may have been too low at the time, as this was a population of health care workers but is probably too high for the general population now. The study in question had 297 participants.
| Sick | Healthy | Totals | |
|---|---|---|---|
| Positive Test | 22 | 2 | 24 |
| Negative Test | 7 | 266 | 273 |
| Totals | 29 | 268 | n=297 |
Confirming that my numbers at least comform with what the study said:
Sensitivity:
\[\frac{TP}{TP+FN}\] \[\frac{22}{22+7} \approx .73\]Which makes the false negative rate seem high, right (.27)?
Specificity:
\[\frac{TN}{TN+FP}\] \[\frac{266}{266+2} \approx .99\]Well, our numbers more or less work out. But as I said, we wanted predictive value - we don’t know if my friend has covid or not, just that he got a negative test. We want to predict a single individual who got a positive or negative test. Positive predictive value is calculate as the proportion of people who got positive tests and were sick to the total number of people got positive tests. But my friend got a negative test. So we want the negative predictive value: the proportion of people who were healthy and tested negative to the total number who tested negative.
Positive Predictive Value:
\[\frac{TP}{TP+FP}\] \[\frac{22}{22+2} \approx .92\]Negative Predictive Value:
\[\frac{TN}{TN+FN}\] \[\frac{266}{266+7} \approx .97\]In words: If you get a positive covid test with the at home test, you have an 8% chance of not having covid. In contrast, if you test negative you have a 3% chance of having covid. Both predictive values are pretty decent, but negative predictive value is better. How could this be, if false negative rate is high?
It all comes down to the assumption made when we decided how many people were actually sick. The “sick” world is already much smaller than the “healthy” world and the predictive value is correlated to it. If you were to make the assumption that the population prevalance was 50%, the NPV goes down to .78, and the PPV goes up to .98 even with the same sensitivity and specificity. We’ve never been in a situation where it made sense to assume that your prior probability of having covid was 50-50.
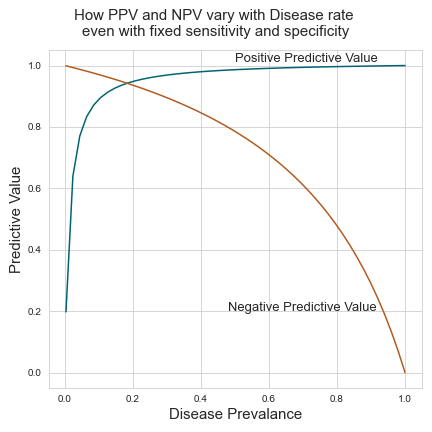
This figure shows how PPV and NPV change when the prevalance of a disease changes even when holding test specificity and sensitivity constant. I’ve kept the population the same (297) and stepped up the total number of sick individuals from 1 to 297 for each point. At each distribution of sick and healthy individuals, I’ve kept the proportion of sick individuals who test positive at 73% of all sick individuals and the proportion of healthy individuals who test negative at 99% of all healthy individuals.
In conclusion, the doctor wasn’t wrong - the false negative rate is high when the sensitivity is low, but it matters what the prevalence of the disease is in your population if you want to tell a particular patient how to interpret their results from a test.
Image by v-a-n-3-ss-a from Pixabay
-
If you’re in a situation where the background prevalance of covid is so high that a test like this gives you no better than a coin flip’s chance of being covid-free, it’s probably best that everyone act like everyone has covid. That’s essentially what a lockdown is. Before you have an accurate estimate of population prevalance, you can’t accurately calculate a positive or negative predictive value. ↩